- Why LoCorr
A LEADER IN LOW-CORRELATION INVESTMENT SOLUTIONS FOR 20 YEARS
- Investment Solutions
- Insights & Education
- Literature

Equities are well-known investments that have been a core holding in investor portfolios for decades. Over the last 28 years, equities (such as U.S. stocks), have provided an average annual return of 9.7%. However, as the chart below illustrates, with this performance often comes significant volatility. This has led investors to search for new opportunities that might allow them to better limit the downside while still participating in the return potential of the upside.
January 1, 1997 to June 30, 2025
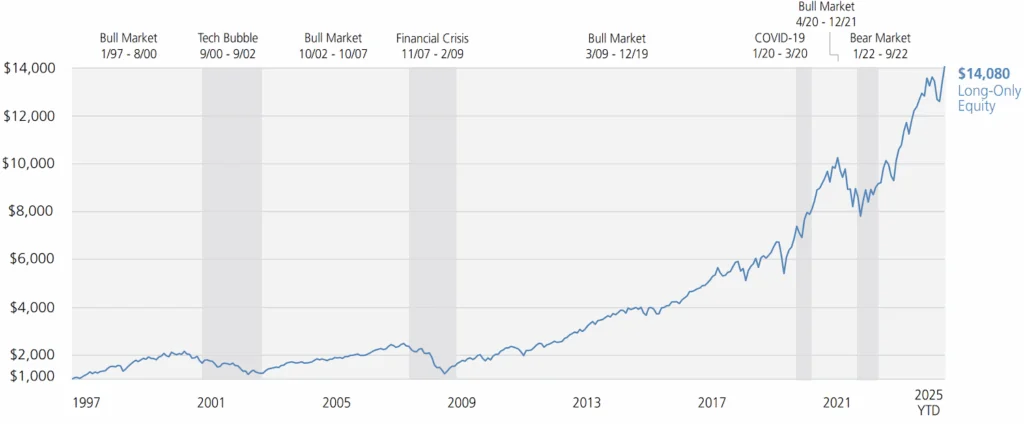
Time period 1/1/97-6/30/25. Long-only Equity is represented by S&P 500 TR Index. Past Performance is not a guarantee of future results. The referenced index is shown for general market comparisons and is not meant to represent the Fund. One cannot invest directly in an index. Fund performance may be obtained by calling 1.855.LCFUNDS (1.855.523.8637). Source: Morningstar Direct
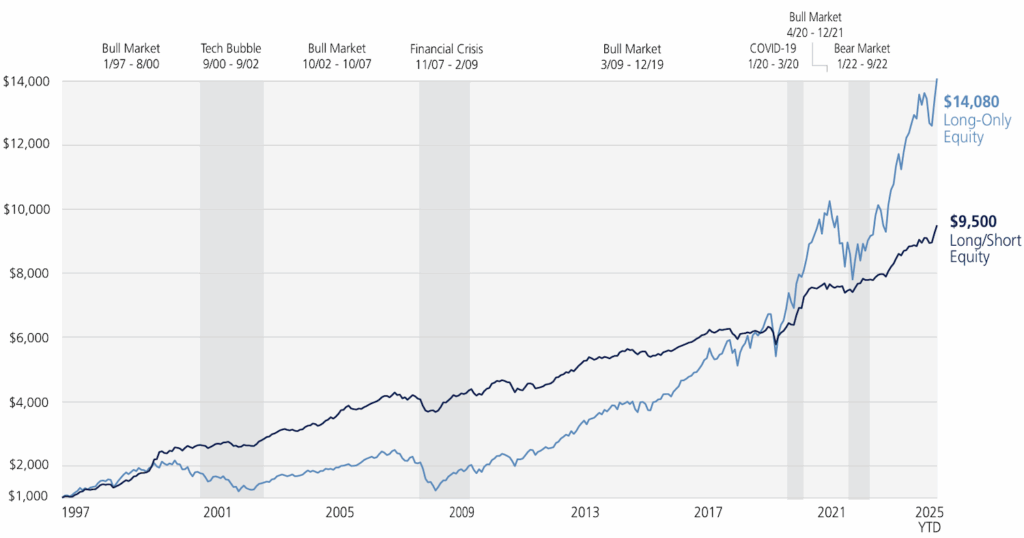
A long/short equity strategy takes long positions in stocks that are expected to increase in value and short positions in stocks that are expected to decrease in value. With this approach, an investor has the potential to capture much of the market upside while limiting downside loss. Since 1997, over 342 months, the S&P 500 Index was down in 113 of those months. As shown in the chart below, during those negative months for the S&P 500, a long/short equity strategy outperformed the Index by experiencing only 20% of the downside, while capturing over 42% of the upside. As a result of limiting the downside, investing in a long/short equity strategy provides the potential for reduced volatility.
| S&P 500: 228 Up Months | S&P 500: 113 Down Months | ||
|---|---|---|---|
| Long-Only Equity Average Annual Return | 3.42% | Long-Only Equity Average Annual Return | -3.94% |
| Long/Short Equity Average Annual Return | 1.46% | Long/Short Equity Average Annual Return | -0.80% |
| Capture Ratio | 42.65% | Capture Ratio | 20.36% |
The reference to indices are shown for general market comparisons and are not meant to represent any Fund. Long-Only Equity refers to S&P 500 TR Index, Long/Short Equity refers to Barclay Long/Short Equity Index. Barclay Long/Short Equity Index inception date 1/1/1997. Up Capture compares an investment’s performance against its benchmark during periods when the benchmark’s performance is positive, while Down Capture compares the investment’s performance against the benchmark during periods when the benchmark’s performance is negative. A value of greater than 100% indicates that the investment captured more return than the benchmark (this is a positive for Up Capture, however, a negative for Down Capture). Conversely, a value less than 100% means the investment captured less return than its benchmark (a positive for Down Capture, but a negative for Up Capture). Source: LoCorr Fund and Morningstar Direct.
History shows that long/short equity strategies have often outperformed the long-only S&P 500 Index in both bull markets and crisis periods. As shown below, long/short equities have historically achieved better risk-adjusted performance over market cycles than long-only strategies, with significantly lower volatility than long-only equity.
| Annualized Return | Sharpe Ratio | Beta | Standard Deviation | Max Drawdown | |
| Long/Short Equity | 8.22% | 0.90 | 0.30 | 6.65 | -14.24% |
| Long-Only Equity | 9.72% | 0.53 | 1.00 | 15.51 | -50.95% |
Past performance is not a guarantee of future results. The referenced indices are shown for general market comparisons and are not meant to represent any Fund.
Period: 1/1/97-6/30/25. Long/Short Equity refers to Barclay Long/Short Equity Index; Long-only Equity refers to S&P 500 Total Return Index. Crisis periods are defined as periods of time when the S&P 500 TR Index experienced a max drawdown of 25% or more. Source: Morningstar Direct.
Correlation dynamics have shifted over time, impacting the effectiveness of traditional diversification approaches. Rebalancing to include low-co...
Read MoreOur investment solutions are designed for investment professionals and individual investors who are seeking to achieve better diversification and...
Read MoreInvestors may want investments that act differently than their traditional portfolio div...
Sign in to Read MoreClick here for important disclosure information.
Diversification does not assure a profit nor protect against loss in a declining market.
Mutual fund investing involves risk. Principal loss is possible. The Fund’s investment objectives, risks, charges and expenses must be considered carefully before investing. The prospectus contains this and other important information about the investment company, and it may be obtained by clicking here or a free-hard copy is available by calling 1.855.LCFUNDS. Read it carefully before investing. The Funds are offered only to United States residents, and information on this site is intended only for such persons. Nothing on this website should be considered a solicitation to buy or an offer to sell shares of the Funds in any jurisdiction where the offer or solicitation would be unlawful under the securities laws of such jurisdiction. The LoCorr Funds are distributed by Quasar Distributors, LLC.
If you have previously created a password protected account from LoCorr Funds, please sign in below to view gated materials.
Please enter your company email address. You will receive an email message with instructions on how to reset your password.
Send Recovery EmailThank you. A password reset email will be sent to you soon.