By Curt LaChappelle, CFA®, Portfolio Manager
This quote is often associated with Albert Einstein and mystery novelist Rita Mae Brown, addressing the need for change in the face of failure. Many have found the applicability of this quote in life’s challenges. Personally, the quote fits my golf game. The expectation to score low and hit every shot without intense practice or dissection of the fundamentals could be considered insane. Is this rational? More often than not, it isn’t. It is often easier to just hope for the best or make surface level changes like buying new golf clubs or simply blaming the density of sand in the bunkers I am frequenting. However, do these quick fixes or blaming really help my golf game in the future?
All the quick fixes, blaming, and repetitions without addressing the root cause draws parallels to investing. In my role, I am fortunate to speak to a wide range of investors, from institutional sector specialists studying commodity market supply and demand structure to financial advisors looking to solve multi-generational wealth transfers.
For this short article, I want to focus on institutional allocators, financial advisors, and retail clients and challenge “the way things have been done,” with respect to asset allocation, meaning repeatedly using bonds to diversify stocks.
Since 1986 until recently, bonds have been in a structural bull market, as represented by the Bloomberg U.S. Aggregate Bond Index. For a multitude of reasons, interest rates fell from the 1970’s until 2020, creating a substantial tailwind for bonds. But even more interesting and, in our view, detrimental to the way many allocate today, bonds became rooted in human psychology as the “safe pick” or “no brainer”. Amongst a whole host of reasons, the perceived benefits of bonds largely fall into two broad categories: return (via income or price appreciation) and diversification.
As of 12/31/2024, the U.S. 10-Year Treasury yielded 4.39%, not a bad pre-tax/pre-inflation adjusted income level for something backed by the full faith and credit of the U.S. Government. By using yield as a rough proxy for forward return expectations and assuming all else constant (low inflation, no movement in rates, and continued all-time tight credit spreads), you are hoping the future is brighter than the last 5 to 10 years.
| YTD | 1- Year | 3-Years | 5- Years | 10-Years | 15-Years | 20-Years | |
| Bloomberg U.S. Aggregate Bond Index | 1.25% | 1.25% | -2.41% | -0.33% | 1.35% | 2.37% | 3.01% |
| S&P 500 Index | 25.02% | 25.02% | 8.94% | 14.53% | 13.10% | 13.88% | 10.35% |
Source: FRED, Economic Research Division.
However, going back even further, say 20 years an allocation to bonds for return has not been anything to write home about. The above table may be shocking; the “safe pick” or “sure bet” has only returned 3.01% over the past 20 years? However, the more shocking point is the second benefit of bonds, or current lack thereof, diversification.
The correlation between equity and fixed income market indices has been steadily rising, reaching a level not seen since the inception of the Bloomberg U.S. Aggregate Bond Index in 1986. With a correlation nearing +0.7, the diversification “free lunch” as described by the Nobel prize winner Harry Markowitz, is now looking for payment.
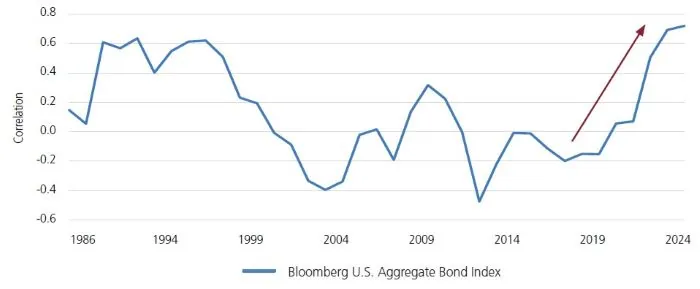
Source: LoCorr Fund Management and Morningstar Direct. Time period is 1/1/86-12/31/24. Past performance does not guarantee future results.
Since the start of 2020, when stock & bond correlation started to move meaningfully positive, there have been 12 pullbacks in the S&P 500 of -5% or more with bonds being positive in only 3 of these instances.
| 2/20/20-3/23/20 | 3/27/20-4/1/20 | 6/9/20-6/11/20 | 9/3/20-9/23/20 | 10/13/20-10/30/20 | 9/3/21-10/4/21 | 1/4/22-10/12/22 | 12/1/22-12/28/22 | 2/2/23-3/13/23 | 8/1/23-10/27/23 | 3/29/24-4/19/24 | 7/17/24-8/5/24 | |
| Bloomberg U.S. Aggregate Bond Index | -0.94% | 1.01% | 0.70% | -0.33% | -0.22% | -0.78% | -14.38% | -0.60% | -1.46% | -4.41% | -2.36% | -2.21% |
| S&P 500 Index | -33.79% | -6.04% | -7.11% | -9.52% | -7.43% | -5.12% | -24.49% | -7.16% | -6.16% | -9.94% | -5.40% | -8.45% |
This brings us back to the insanity quote; is there a better way to balance equity risk than with bonds? Or should we hope correlation falls back into negative territory and the next 20 years are better than the last? Is hope a strategy when historically, stock and bond correlation has gone decades in positive territory? Should we search for short-term band-aid fixes like finding the next 10 bagger stock or attributing this market environment as completely different, too hard, and full of imperfect sand quality?
While the consideration of returns is often first analyzed, in the context of portfolio construction and asset allocation, correlation is paramount. And since 2020, as bond correlation has picked up, managed futures/global macro, as represented by the CISDM CTA Index has provided the diversification that bonds have not.
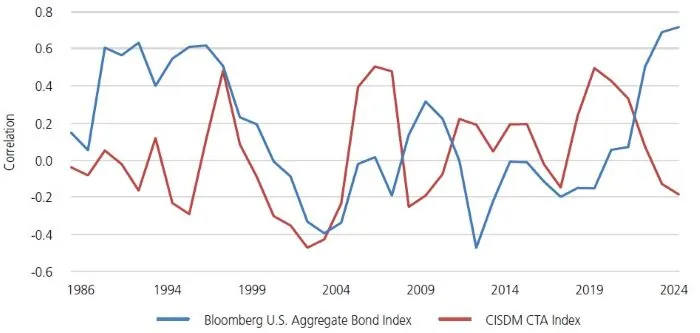
Source: LoCorr Fund Management and Morningstar Direct. Time period is 1/1/1986-12/31/24. Past performance does not guarantee future results.
And over the long term, the correlation benefit has translated into better performance, or more money, +102% more money.
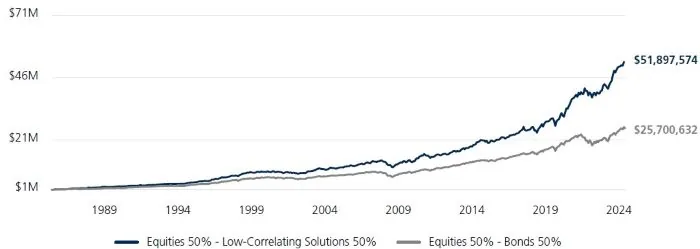
Source: LoCorr Fund Management and Morningstar Direct. Equities represented by the S&P 500 Index, Low-Correlating Solutions represented by the CISDM CTA Index, and Bonds represented by the Bloomberg U.S. Aggregate Bond Index. Past performance does not guarantee future results.
Asking what is at the root cause of our frustration, not short-term band-aid fixes, can often lead us to making changes for the better leading our insanity away from the markets and reserving the infuriation for the golf course.
LoCorr Funds is pleased to announce the launch of the LoCorr Strategic Allocation Fund (LSAIX, LSAAX), a daily liquid mutual fund designed to hel...
Read MoreOur investment solutions are designed for investment professionals and individual investors who are seeking to achieve better diversification and...
Read MoreWhen the market is turbulent, investors may be motivated to look for new ways to diversif...
Sign in to Read MoreClick here for important disclosure and definition information.
Past Performance does not guarantee future results. Index performance is not indicative of fund performance. For current standardized fund performance, please call 1.855.LCFunds or visit www.LoCorrFunds.com. The performance of various indices is shown for comparison purposes only. The performance of those indices was obtained from published sources believed to be reliable, but which are not warranted as to accuracy or completeness. Unless noted otherwise, index returns do not reflect fees or transaction costs and reflect reinvestment of net dividends. One cannot invest directly in an index.
Correlation measures how much the returns of two investments move together over time. Diversification does not assure a profit or protect against loss in a declining market.
The Fund’s investment objectives, risks, charges, and expenses must be considered carefully before investing. The prospectus contains this and other important information about the investment company, and it may be obtained by calling 1.855.LCFUNDS, or visiting www.LoCorrFunds.com. Read it carefully before investing.
Mutual fund investing involves risk. Principal loss is possible. The Funds are non-diversified, meaning it may concentrate its assets in fewer individual holdings than a diversified fund. Therefore, the Funds are more exposed to individual stock volatility than a diversified fund. The Funds invest in foreign investments and foreign currencies which involve greater volatility and political, economic and currency risks and differences in accounting methods. These risks are greater for emerging markets. The Funds may make short sales of securities, which involves the risk that losses may exceed the original amount invested. Investing in commodities may subject the Funds to greater risks and volatility as commodity prices may be influenced by a variety of factors including unfavorable weather, environmental factors, and changes in government regulations. Investing in derivative securities derive their performance from the performance of an underlying asset, index, interest rate or currency exchange rate. Derivatives can be volatile and involve various types and degrees of risks, and, depending upon the characteristics of a particular derivative, suddenly can become illiquid. Derivative contracts ordinarily have leverage inherent in their terms which can magnify the Fund’s potential for gains or losses through increased long and short position exposure. The Fund may access derivatives via a swap agreement. A risk of a swap agreement is the risk that the counterparty to the agreement will default on its obligation to pay the Fund. Investments in debt securities typically decrease in value when interest rates rise. This risk is usually greater for longer-term debt securities. Investments in Asset Backed, Mortgage Backed, and Collateralized Mortgage-Backed Securities include additional risks that investors should be aware of such as credit risk, prepayment risk, possible illiquidity and default, as well as increased susceptibility to adverse economic developments. The LoCorr Dynamic Equity Fund may invest in small- and medium-capitalization companies which involve additional risks such as limited liquidity and greater volatility. The Fund may also invest in lower-rated and non-rated securities which present a greater risk of loss to principal and interest than higher-rated securities. ETF investments are subject to investment advisory and other expenses, which will be indirectly paid by the Fund. As a result, the cost of investing in the Fund will be higher than the cost of investing directly in ETFs and may be higher than other mutual funds that invest directly in stocks and bonds. ETFs are subject to specific risks, depending on the nature of the ETF. The Spectrum Income Fund’s portfolio will be significantly impacted by the performance of the real estate market generally, and the Fund may be exposed to greater risk and experience higher volatility than would a more economically diversified portfolio. Property values may fall due to increasing vacancies or declining rents resulting from economic, legal, cultural, or technological developments. Investments in Limited Partnerships (including master limited partnerships) involve risks different from those of investing in common stock including risks related to limited control and limited rights to vote on matters affecting the Limited Partnership, risks related to potential conflicts of interest between the Limited Partnership and the Limited Partnership’s general partner, cash flow risks, dilution risks and risks related to the general partner’s limited call right. Underlying Funds are subject to management and other expenses, which will be indirectly paid by the Fund.
The LoCorr Funds are distributed by Quasar Distributors, LLC. © 2025 LoCorr Funds
If you have previously created a password protected account from LoCorr Funds, please sign in below to view gated materials.
Please enter your company email address. You will receive an email message with instructions on how to reset your password.
Send Recovery EmailThank you. A password reset email will be sent to you soon.